
4D Chart v12
CT Chart arrays
- 4D Chart Language
-
- CT Chart
-
- CT Chart arrays
- CT Chart data
- CT Chart selection
- CT EXPLODE PIE
- CT GET 3D VIEW
- CT GET AXIS ATTRIBUTES
- CT GET CHART COORDINATES
- CT GET CHART FILL ATTRIBUTES
- CT GET CHART LINE ATTRIBUTES
- CT GET CHART OPTIONS
- CT GET CHART PART
- CT Get chart picture
- CT GET CHART TEXT ATTRIBUTES
- CT Get chart type
- CT GET DATE SCALE
- CT GET DEPTH
- CT GET LABEL ATTRIBUTES
- CT GET LEGEND ATTRIBUTES
- CT Get legend text
- CT GET REAL SCALE
- CT GET TIPS ATTRIBUTES
- CT GET TITLE ATTRIBUTES
- CT GET VALUE ATTRIBUTES
- CT GET X DATE SCALE
- CT GET X REAL SCALE
- CT SET 3D VIEW
- CT SET AXIS ATTRIBUTES
- CT SET CHART COORDINATES
- CT SET CHART FILL ATTRIBUTES
- CT SET CHART LINE ATTRIBUTES
- CT SET CHART OPTIONS
- CT SET CHART PICTURE
- CT SET CHART TEXT ATTRIBUTES
- CT SET CHART TYPE
- CT SET DATE SCALE
- CT SET DEPTH
- CT SET LABEL ATTRIBUTES
- CT SET LEGEND ATTRIBUTES
- CT SET LEGEND TEXT
- CT SET REAL SCALE
- CT SET TIPS ATTRIBUTES
- CT SET TITLE ATTRIBUTES
- CT SET VALUE ATTRIBUTES
- CT SET X DATE SCALE
- CT SET X REAL SCALE
- CT SHOW GRID LINES
- CT UPDATE CHART
 CT Chart arrays
| CT Chart arrays ( area ; type ; size ; categoryArray ; seriesArray ; valuesArray ) -> Function result | ||||||||
| Parameter | Type | Description | ||||||
| area | Longint |

|
4D Chart area | |||||
| type | Integer |
|
Type of graph (see codes below) | |||||
| size | Integer |
|
Option for initial size of graph 1 = Variable 2 = Relative to window (Auto-Variable) 3 = Relative to graph (Auto-Document) | |||||
| categoryArray | Array |
|
Array of categories | |||||
| seriesArray | Array |
|
Array of series | |||||
| valuesArray | Array |
|
Array of values | |||||
| Function result | Longint |

|
Object ID number | |||||
CT Chart arrays creates a graph based on the specified arrays and returns the graph’s Object ID. This command can be used to create either a two-dimensional or three-dimensional graph.
The following table lists the codes for the type parameter.
| Code | Chart Type |
| 1 | Area |
| 2 | Column |
| 3 | Picture |
| 4 | Line |
| 5 | Scatter |
| 6 | Pie |
| 7 | Polar |
| 8 | 2D XY |
| 100 | 3D Column |
| 101 | 3D Line |
| 102 | 3D Area |
| 103 | 3D Surface |
| 104 | 3D Triangle |
| 105 | 3D Spike |
The size parameter determines how much space the graph fills when it is generated and how the graph size changes when you resize the window:
- If you pass 1 (size Variable), the graph will fill the 4D chart area or the window. It will keep this size until you modify it using the handles.
- If you pass 2 (size Relative to the window), the graph will fill the 4D chart area or the external window. If you later change the size of the window, the graph will adapt automatically. However, once you modify the size of the graph using the handles, this change will not take place anymore.
- If you pass 3 (size Relative to the document), the graph will adapt to the dimensions of the page that you selected in the Page Setup dialog. It will keep this size until you modify the graph size using the handles.
The categoryArray parameter contains the X-axis categories.
seriesArray contains the series. In a two-dimensional graph, the series is displayed on the Category axis. In a three-dimensional graph, the series is displayed on the Series axis.
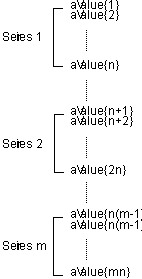
valuesArray is a one-dimensional array that contains all the values to be graphed on the Values axis. valuesArray must be filled in so that there is a value for each element of the categoryArray and seriesArray. That is, if there are n categories and m series, there will be n*m elements in valuesArray.
The following illustration shows the order in which valuesArray should be filled. n represents the total number of categories. m represents the total number of series.
For example, consider the following data and resulting Values array:
| School (Categories) | Year (Series) | Students(Values) | aValues |
| Sunnyoaks | 1990 | 1000 | aValues{1}:=1000 |
| Sunnyoaks | 1992 | 1250 | aValues{2}:=600 |
| Sunnyoaks | 1994 | 800 | aValues{3}:=1250 |
| Valley | 1990 | 600 | aValues{4}:=975 |
| Valley | 1992 | 975 | aValues{5}:=800 |
| Valley | 1994 | 1100 | aValues{6}:=1100 |
Product: 4D Chart
Theme: CT Chart
Number:
14526
Created: 4D Chart 1
CT Chart data
CT Chart selection


